![]() Editing directly from the chart
Editing directly from the chart
|
|
Top Previous Next |
|
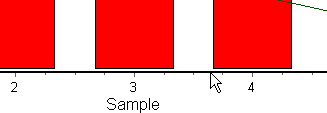
The chart is active, and features of the plot can be edited by moving the cursor over them and double-clicking on the feature of the plot you wish to alter. For example, to edit the x-axis, move the cursor over the axis like this:
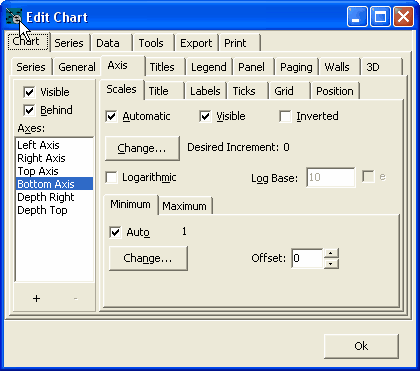
and then double-click. The following dialog window will pop up allowing you to change the chart defaults.
|